Mrs. Brice's Cruise Logs, Jan.-Feb. 2005 |
|
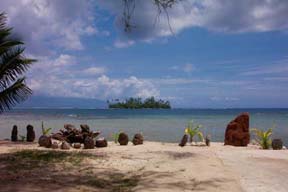 The island of Moorea the |
Mrs. Brice boarded the R/V Roger Revelle in the Southern Pacific Ocean south of New Zealand in January 2005. She flew to Tahiti January 4th and spent several days there before meeting the ship and sailing south toward the continent of Antarctica to observe and share the water sampling cruise with her students.
|
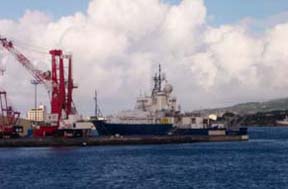 The R/V Revelle in Papeete the |
|
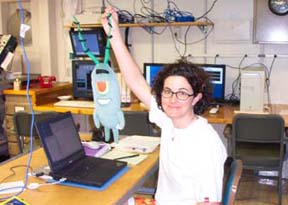 Chief Scientist, Dr. Sloyan with "plankton" the |
Mrs. Brice's Daily Logs
|
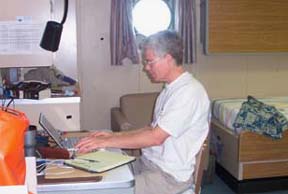 Dr. Swift at work the |
|
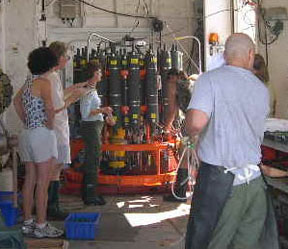
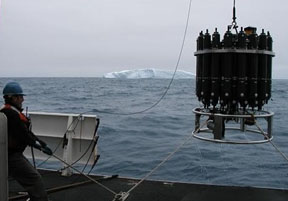
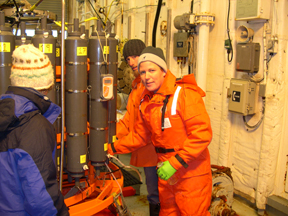
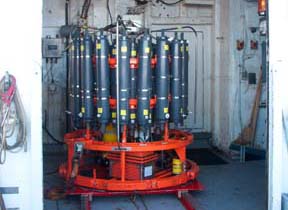 The CTD for collecting water samples |
January 10, 2005: Log #2 Log #2 Summary: Position: Lat: 16-43.3S, LONG: 150-00.0W We are traveling south. The first live broadcast is today and I will show my students the main lab and introduce them to some of the groups working on the water analysis. I am learning how to participate in the deployment and sampling of the CTD. I learned to operate the hydraulic boom to deploy and retrieve the CTD and how to record the sampling order of the bottles. One of the groups working in the main lab are the CFC (chlorofluorocarbons) analysis are from the Rosenthiel School of Marine and Atmospheric Sciences. We are repeating a run that was done in the 1990s and will be able to see the differences in concentrations of the various trace metals and dissolved gasses. In class, my students are learning about the constituents of seawater, concentrations of salts and trace metals, and dissolved gasses. We will be looking at their distribution within different water masses amd their relationship to Thermohaline circulation. the |
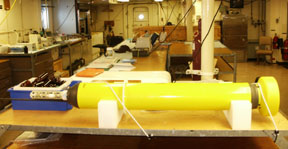 ARGO float being prepared in the main lab xxx |
January 11, 2005: Log #3 Log #3 Summary: Position: Lat: 18-31.3S, LONG: 150-00.0W We are doing about three CTD casts each day at 30 miles apart. The weather is really warm and the sea is calm. We were able to see the Southern Cross from the bow in the clear sky tonight. We did the first broadcast yesterday from the main lab. I introduced my class to members of the sampling group from UCSB. Chantal Swan, a grad student, introduced herself and explained that her group is taking carbon samples from the water. She spoke about how her interest in oceanography began and what motivated her to pursue a career in science. I showed the students one of the Argo floats that are being deployed on this cruise. Marine Technician Scott Hiller and Dr. Jergen Thiess were preparing the float. Eighteen countries are pargicipating in the ARGO. I introduced two of the crew members on the Revelle: Ablebodied seaman Heather Galiher and Botswain Jim Pearson. They spoke briefly about their duties on the ship. Future broadcasts will be from other locations on the ship and will introduce more crew members. the |
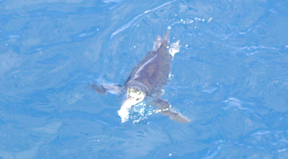
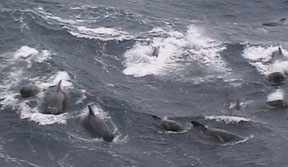 Pilot whales feeding on squid |
|
Climate Variability & Predictability World Climate Research Programme |
January 12, 2005: Log #4 Log #4 Summary: Position: Lat: 20-30.0S, LONG: 150-00.0W Another beautiful, warm day and very calm seas. We did the second broadcast yesterday into my 7th period class and introduced the chief scientist, Bernadette Sloyan, a researcher from Woods Hole Oceanographic Institution. The students had questions for her about weather, our location, salinity, and why salinity is used as an indicator of water mass. This cruise is part of the CLIVAR program, which is an international project on Climate variability and predictability. Some of the parameters they are looking at in the water samples are: oxygen levels, CFCs (chloroflourocarbons), temperature, carbon, salinity, nutrients, bacteria, trace minerals, alkalinity, tritium, helium, and several others. However, they do not sample for all of these every time. Many of these characteristics are linked to particular water masses and by looking at these indicators, the location and movement of these various water masses can be plotted. the |
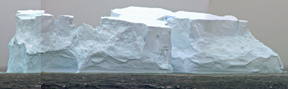 A big iceberg xxxx |
|
 Another CTD cast for Dr. Measures |
January 13, 2005: Log #5 Log #5 Summary: Position: Lat: 22-28.0S, LONG: 150-00.0W The weather is still warm and beautiful. Last August, I told my students that, according to NOAA and NASA, we were going to have a mild El Niño. From torrential rains in Southern California to devastating wildfires in Australia, it is certainly shaping up to be an El Niño. As we discussed in class, during an El Niño event, the trade winds weaken. Warm, nutrient-poor water occupies the entire tropical Pacific Ocean. Heavy rains, which are tied to the warm water, move into the central Pacific and cause drought in Australia and Indonesia. The water temperatures in the western Pacific have also changed enough that commercial fish are not where they normally would be found. My students are to consider what it would be like for fishermen, who are counting on catching those fish to earn a living, to discover that they are not in the right place to catch them. Could they have used the predictions of NOAA to help them decide where to fish this year? Do we have a system that is reliable enough to make economic decisions like this? We will see if we find any differences in typical sea surface temperatures while we are taking samples here. the |
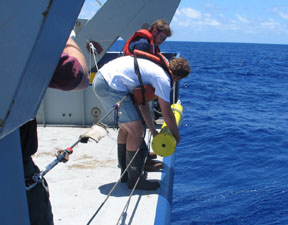 Scott Hiller & Dr. Thiess lower the ARGO into the water |
January 14, 2005: Log #6 Log #6 Summary: Position: Lat: 24-00.0S, LONG: 150-00.0W We can feel the air cooling slightly. There are many clouds on the distant horizon and we can see the rainstorms. A group from the Rosenthiel School of Oceanic and Atmospheric Sciences in Coral Gable, Florida is working on this cruise. Dr. David Cooper and technician Charlene Grall are doing CFC sampling from the CTD rosette. The Rosenthiel School has been involved in the CLIVAR program from the beginning of it. CLIVAR is investigating the carbon cycle. The oceans contain nearly 50 times as much carbon dioxide as the atmosphere. Small changes in the ocean carbon cycle can have large atmospheric consequences. Climate changes are predicted to occur in the next 50 to 100 years as a result of rapidly rising levels of carbon dioxide and other greenhouse gases. Computer models indicate that the oceans are currently taking up at least a third of the man-made carbon dioxide by dissolving it in the water. One of the things being investigated by some scientists is whether we could increase the phytoplankton production to have them take up more CO2 out of the atmosphere. the |
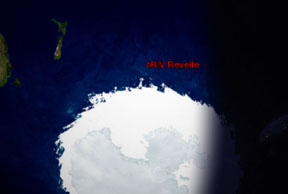 R/V Revelle's position in early February the |
January 15, 2005: Log #7 Log #7 Summary: Position: Lat: 26-00.0S, LONG: 150-00.0W The weather is very warm and the sea is relatively calm. We are still doing round-the-clock CTD casts. I am helping to lower and raise the CTD. Another group on this cruise is from the University of California Santa Barbara. A graduate student with the group is Stuart Golberg. I asked Stu to explain what his research on the cruise is about and his other interests. Stu is from Montgomery, New York with a B.S. degree in Marine Science. His research involves how the ocean serves as a storage mechanism for carbon compounds. He is interested in understanding how marine microbes (bacteria) process certain organic carbon compounds. Understanding bioavailability of the pool of dissolved organic material in the world's oceans will yield further information regarding the exchange of carbon between the atmosphere and the surface ocean. the |
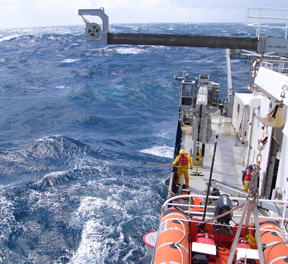
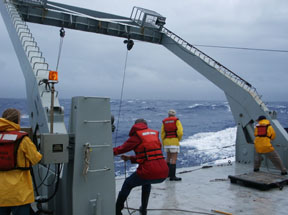
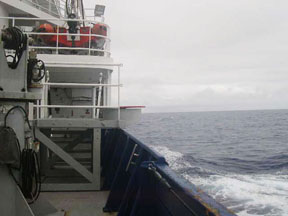 The weather gets rougher approaching the "Roaring 40s" |
January 16, 2005: Log #8 |
 Bringing up the CTD the |
January 17, 2005: Log #9 |
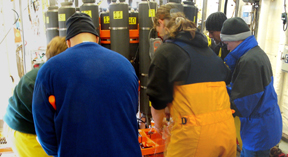
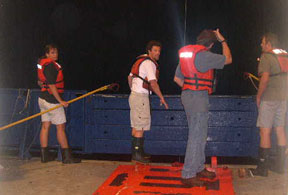
 Sampling in the staging bay |
January 19, 2005: Log #11 I am now sample cop. That is the person with a clipboard that keeps track of the order of sampling, bottle numbers, types of samples collected, etc. I am also learning how to direct the rosette up and down. A penguin was spotted last night. No one is seasick yet, although there is quite a bit of motion. I am starting my interviews. I will do a broadcast at 9:45 tomorrow from the bridge with Captain Dave. He will have several other crew members there also to answer students' questions. |
 Captain Dave takes a picture of an iceberg |
January 20, 2005: Log #12 Tomorrow we will be broadcasting from the bridge of the R/V Roger Revelle and my students will tour the bridge with the Captain and be able to ask him questions about his interests and insights into life at sea. |
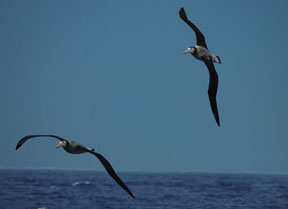 Albatross following the Revelle xxx |
January 21, 2005: Log #13 |
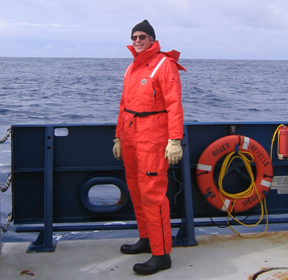 Dr. Bill Landing models an all-weather safety suit |
|
|
January 24, 2005: Log #15 The weather is becoming increasingly cold as we have entered the "roaring forties" and we are receiving weather warnings of what is to come. We are shrinking the students' styrofoam cups on some of the deepest casts of the cruise - about 5000 meters - and a plankton tow turned up some good specimens I can send pictures of to my students. |
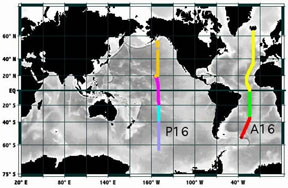 Map showing the concurrent cruises of the R/V Revelle & R/V Ron Brown the |
January 25, 2005: Log #16 |
 Bringing up the CTD aboard the R/V Ron Brown the |
January 26, 2005: Log #17 Log #17 Summary: Position: Lat: 45-00.0S, LONG: 150-00.0W The weather is a little rough today and everyone is bundled up in warmer clothes. Dr. Chris Sabine (NOAA/PMEL) received a message from the R/V Ron Brown today. It is currently in the Atlantic performing the opposite leg of this research cruise. Since they started in the south and are heading north, they already have some great pictures of icebergs. |
|
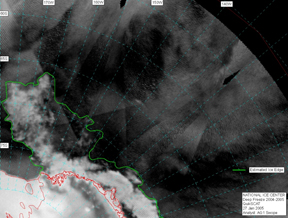
January 27, 2005: Log #18 We are close to the ice shelf and Captain Dave gave me some great iceberg websites to view and track icebergs. My students learned that the smallest icebergs are called "Growlers" and the next largest are called "Bergy Bits". |
|
January 29 & 30, 2005: Log #20 (Sunday) Position: Lat: 50-35.2S, LONG: 150-00.0W We received the weekly report from Dr. Sloyan: "Once again, a successful week of CTD casts with a few difficulties after reaching 46° S with sustained winds and high swells. The main deck is off limits between stations as large waves have crashed over the rail and vans on the fantail. A number of stations had to be abandoned due to poor weather conditions but, the ARGO floats that previously had limited or no satellite transmission are now performing normally. We expect to cross the Sub-antarctic Front and Antarctic Polar Front within the next few days. |
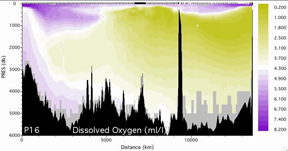 Dissolved oxygen from the Pacific Ocean |
January 31, 2005: Log #21 Some factoids on dissolved gases in seawater: Gases are exchanged between the atmosphere and the ocean at the ocean surface. The surface tension is broken and gas exchange occurs due to wave action. Sea ice is a barrier to gas transfer at the ocean surface. When water is saturated with a gas, the rate the gas dissolves equals the rate in which it escapes into the atmosphere. Cold water holds more saturated gas than warm water. |
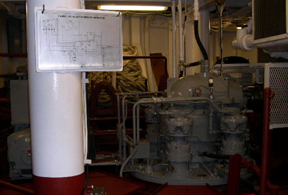
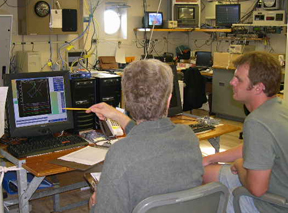 Dr. Swift and Dr. Theiss at the winch control directing the CTD cast from the computer lab xxxx |
February 01, 2005: Log #22 While on the cruise, we have an internal website where the daily and total cruise data are posted, as well as maps of the casts. In the photo at the left, Dr. Swift and Dr. Theiss are discussing the water column profile being generated by the CTD as it goes down. They are looking at pressure, salinity, and temperature, as well as monitoring the depth. In our braodcast to the class, Dr. Measures discussed his study of sampling for trace metals aluminum and iron, and why they are important in the ocean. These metals in the ocean come primarily from dust blown off of the continents. |
|
February 02, 2005: Log #23 I want my students to compare the water mass diagram in the Atlantic with the Pacific. There are big differences and I want them to think about some reasons for these differences. We will discuss the possible reasons for these differences in class. |
|
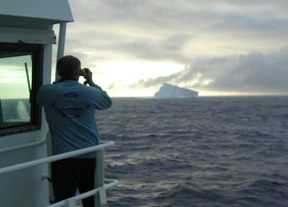
February 03, 2005: Log #24 Did you ever wonder how we can travel at night without running into an iceberg? Yes, radar can detect the larger icebergs, but not the smaller ones. During the day, crew members watch for icebergs with binoculars and during the night, they watch with night-vision binoculars. |
 Deckhand Michelle and iceberg Deckhand Michelle and icebergxxxx |
February 04, 2005: Log #25 Some of the sampling data that was collected on the last cruise and that we are also looking at on this cruise are: dissolved oxygen and nutrients necessary for phytoplankton to thrive. |
 Penguin off the stern! xxx |
February 05, 2005: Log #26 On Tuesday we will cross the Antarctic Circle at 66.5°S and there will be a ceremony, as dictated by ancient seafaring lore, for those accomplishing this for the first time. |
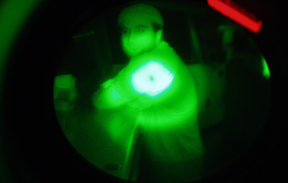 Night-vision equipment in use on deck to watch for icebergs xxxx xxx |
February 07, 2005: Log #27 This week marked the crossing of the Subantarctic Front, Polar Front and Southern Antarctic Circumpolar Current Front. Dramatic property changes were observed in the seawater currents and water masses during the past week. Deployment of the 12 ARGO floats for NOAA's Pacific Marine Environmental Laboratory (PMEL) was completed and all were functioning normally. Icebergs and whales are commonly sighted. A few penguins have also been seen. |
 Justine Afghan sampling CO2 xxx |
February 09, 2005: Log #29 An interview was conducted with Justine Afghan, a lab technician at Scripps Institution of Oceanography. She discussed her educational background, her job duties at SIO and the details of how she has been participating in the water sampling on this particular cruise. |